Overview
All your key metrics, in one place
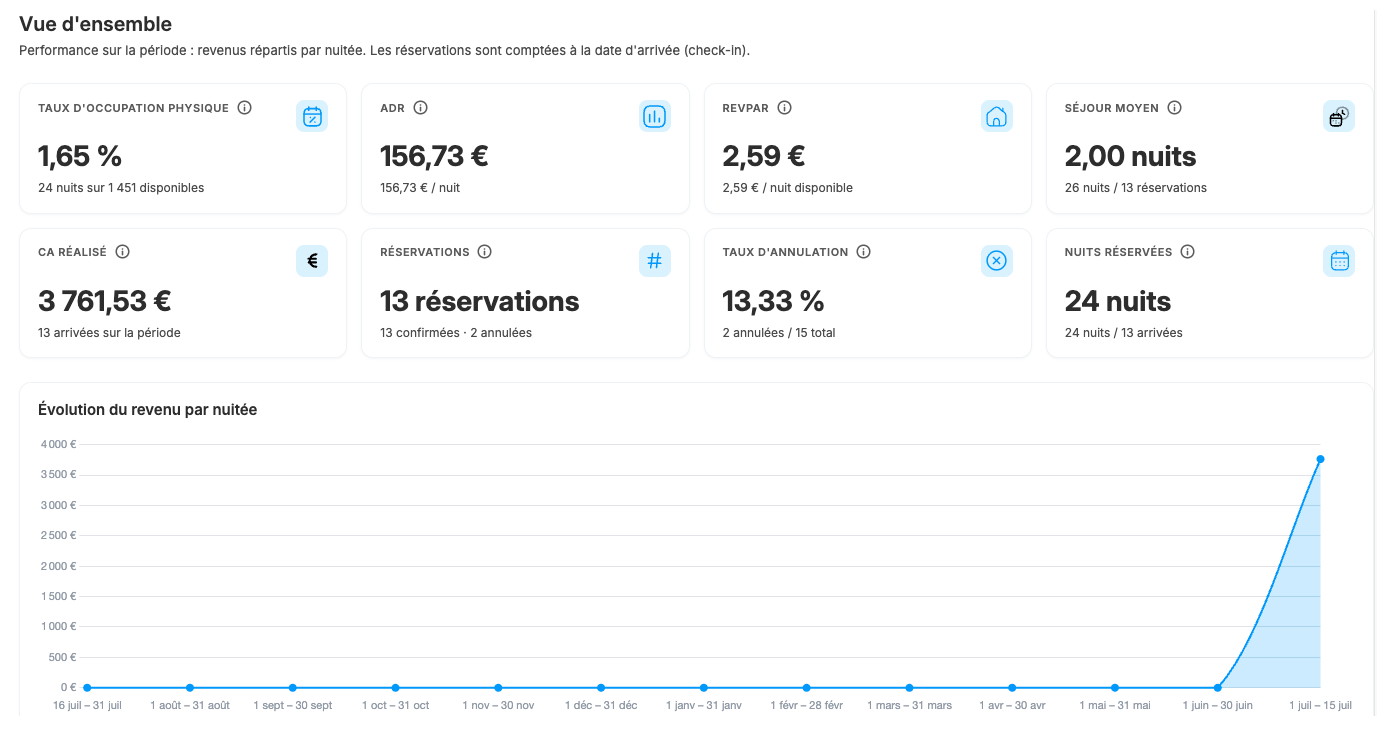
Occupancy rate, ADR, RevPAR, revenue, bookings and cancellations: a quick overview of your portfolio, filterable by date range, property, owner, or platform.
Revenue, occupancy, bookings, cancellations: run your concierge business with reliable, up-to-date numbers, without spreadsheets or manual calculations.
Clear, actionable indicators to understand revenue, occupancy, bookings and cancellations without spreadsheets or guesswork.

Overview
Occupancy rate, ADR, RevPAR, revenue, bookings and cancellations: a quick overview of your portfolio, filterable by date range, property, owner, or platform.
Revenue
Track booked revenue, its month-by-month evolution, and distribution by property to instantly identify your top performers.
Occupancy
Global occupancy, top-performing property, trend over time, and sold/available nights per unit: everything you need to adjust your pricing strategy with confidence.
Bookings & cancellations
Created bookings, most-booked property, cancellation rate and volume by platform and by property, so you can detect trends before they become problems.
Platform mix
Visualize your booked nights split by platform to guide your commercial efforts and distribution strategy.

Quickly compare your rentals, revenue and bookings to make faster decisions and prioritize the right actions.
Your KPIs update automatically so you always see the latest results.
All your rentals live in one place so you can compare performance easily.

See performance gaps clearly so you know where to act first, without digging through endless reports.
Identify at a glance which properties are lifting or dragging down your results.
Focus immediately on the most useful actions for your portfolio.
Occupancy, ADR, RevPAR, revenue, and guest ratings are gathered in one clear dashboard so you can make faster decisions.
Instantly spot your best-performing properties and those that need extra attention.

Monthly, yearly, or custom analysis: see performance evolve clearly so you can adjust your strategy with confidence.
Book a personalized demo and discover how Biloki helps you track revenue, properties, and performance without spreadsheets or guesswork.
Occupancy rate, ADR, RevPAR, realized revenue, number of bookings, cancellation rate, average length of stay, occupied nights, and nights by platform distribution - all viewable by property, by owner, or by platform.
Yes, analytics automatically reflect every new booking, change, or cancellation, with no delay and no manual sync.
Yes, every indicator can be filtered by property, by owner, by platform, or by period.
You can choose a preset period (last 12 months) or customize a date range based on your analysis needs.
Analytics directly show the most booked property and the highest occupancy rate, with property-level details to compare performance easily.
Yes, you can export your analytics for internal reporting or to share with owners.
Owners see the same indicators, but limited to their own property or properties - they do not see data from other assets managed by the concierge team.